
Page 4 - Demo
P. 4
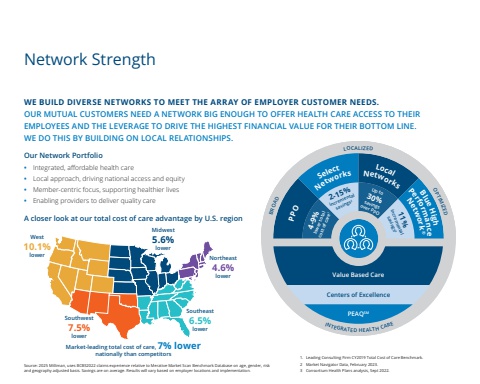
Network Strength WE BUILD DIVERSE NETWORKS TO MEET THE ARRAY OF EMPLOYER CUSTOMER NEEDS.OUR MUTUAL CUSTOMERS NEED A NETWORK BIG ENOUGH TO OFFER HEALTH CARE ACCESS TO THEIR EMPLOYEES AND THE LEVERAGE TO DRIVE THE HIGHEST FINANCIAL VALUE FOR THEIR BOTTOM LINE. WE DO THIS BY BUILDING ON LOCAL RELATIONSHIPS.BROADLOCALIZEDOPTIMIZEDINTEGRATED HEALTH CARECenters of ExcellencePEAQSMPPONetworks NetworksSelectLocalNetwork%u00aePerformanceBlueHigh4-9%lower totalcost of care12-15%incrementalsavings2Up to30%savingsover PPOsavingsincremental11%31. Leading Consulting Firm CY2019 Total Cost of Care Benchmark.2 Market Navigator Data, February 2023. 3 Consortium Health Plans analysis, Sept 2022. Our Network Portfolio%u2022 Integrated, affordable health care%u2022 Local approach, driving national access and equity%u2022 Member-centric focus, supporting healthier lives%u2022 Enabling providers to deliver quality careA closer look at our total cost of care advantage by U.S. regionMarket-leading total cost of care, 7% lowernationally than competitorsWest10.1%lowerMidwest5.6%lowerNortheast4.6%lowerSoutheast6.5%lowerSouthwest7.5%lowerSource: 2025 Milliman, uses BCBS2022 claims experience relative to Merative Market Scan Benchmark Database on age, gender, risk and geography adjusted basis. Savings are on average. Results will vary based on employer locations and implementation. Value Based Care
